AIM
4/3/14
9−1−2
Types of Charts Available
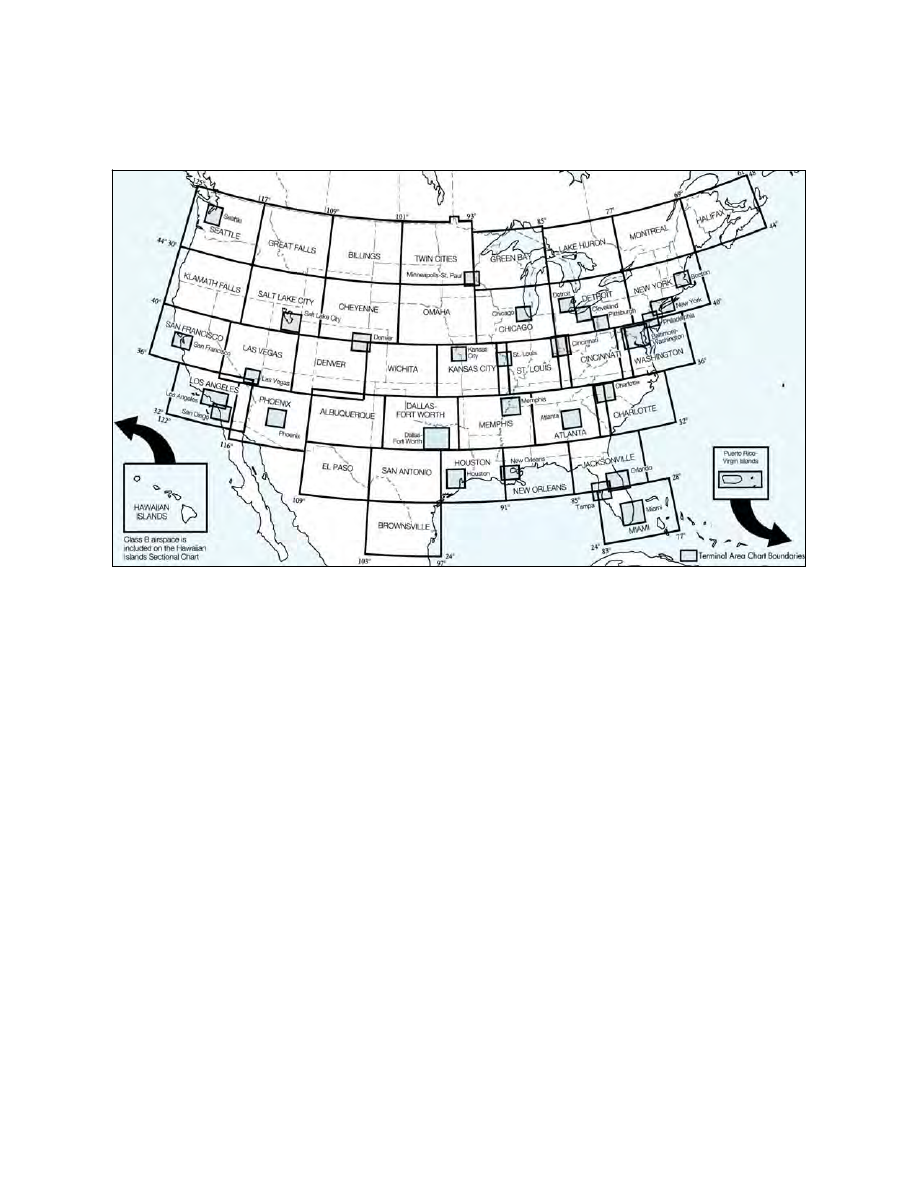
FIG 9
−1−1
Sectional and VFR Terminal Area Charts for the Conterminous U.S.,
Hawaii, Puerto Rico, and Virgin Islands
4. U.S. Gulf Coast VFR Aeronautical Chart.
The Gulf Coast Chart is designed primarily for
helicopter operation in the Gulf of Mexico area.
Information depicted includes offshore mineral
leasing areas and blocks, oil drilling platforms, and
high density helicopter activity areas. Scale 1 inch =
13.7nm/1:1,000,000. 55 x 27 inches folded to
5 x 10 inches. Revised annually.
5. Grand Canyon VFR Aeronautical Chart.
Covers the Grand Canyon National Park area and is
designed to promote aviation safety, flight free zones,
and facilitate VFR navigation in this popular area.
The chart contains aeronautical information for
general aviation VFR pilots on one side and
commercial VFR air tour operators on the other side.
6. Helicopter Route Charts.
A three−color
chart series which shows current aeronautical
information useful to helicopter pilots navigating in
areas with high concentrations of helicopter activity.
Information depicted includes helicopter routes, four
classes of heliports with associated frequency and
lighting capabilities, NAVAIDs, and obstructions. In
addition, pictorial symbols, roads, and easily
identified geographical features are portrayed.
Helicopter charts have a longer life span than other
chart products and may be current for several years.
All new editions of these charts are printed on a
durable plastic material. Helicopter Route Charts are
updated as requested by the FAA. Scale 1 inch =
1.71nm/1:125,000. 34 x 30 inches folded to
5 x 10 inches.
b. IFR Navigation Charts.
1. IFR Enroute Low Altitude Charts
(Conterminous U.S. and Alaska).
Enroute low
altitude charts provide aeronautical information for
navigation under IFR conditions below 18,000 feet
MSL. This four−color chart series includes airways;
limits of controlled airspace; VHF NAVAIDs with
frequency, identification, channel, geographic coor-
dinates; airports with terminal air/ground
communications; minimum en route and obstruction
clearance altitudes; airway distances; reporting
points; special use airspace; and military training
routes. Scales vary from 1 inch = 5nm to 1 inch =
20nm. 50 x 20 inches folded to 5 x 10 inches. Charts
revised every 56 days. Area charts show congested
terminal areas at a large scale. They are included with
subscriptions to any conterminous U.S. Set Low (Full
set, East or West sets).
(See FIG 9−1−2 and FIG 9−1−4.)