886
14 CFR Ch. I (1–1–14 Edition)
Pt. 33, App. B
T
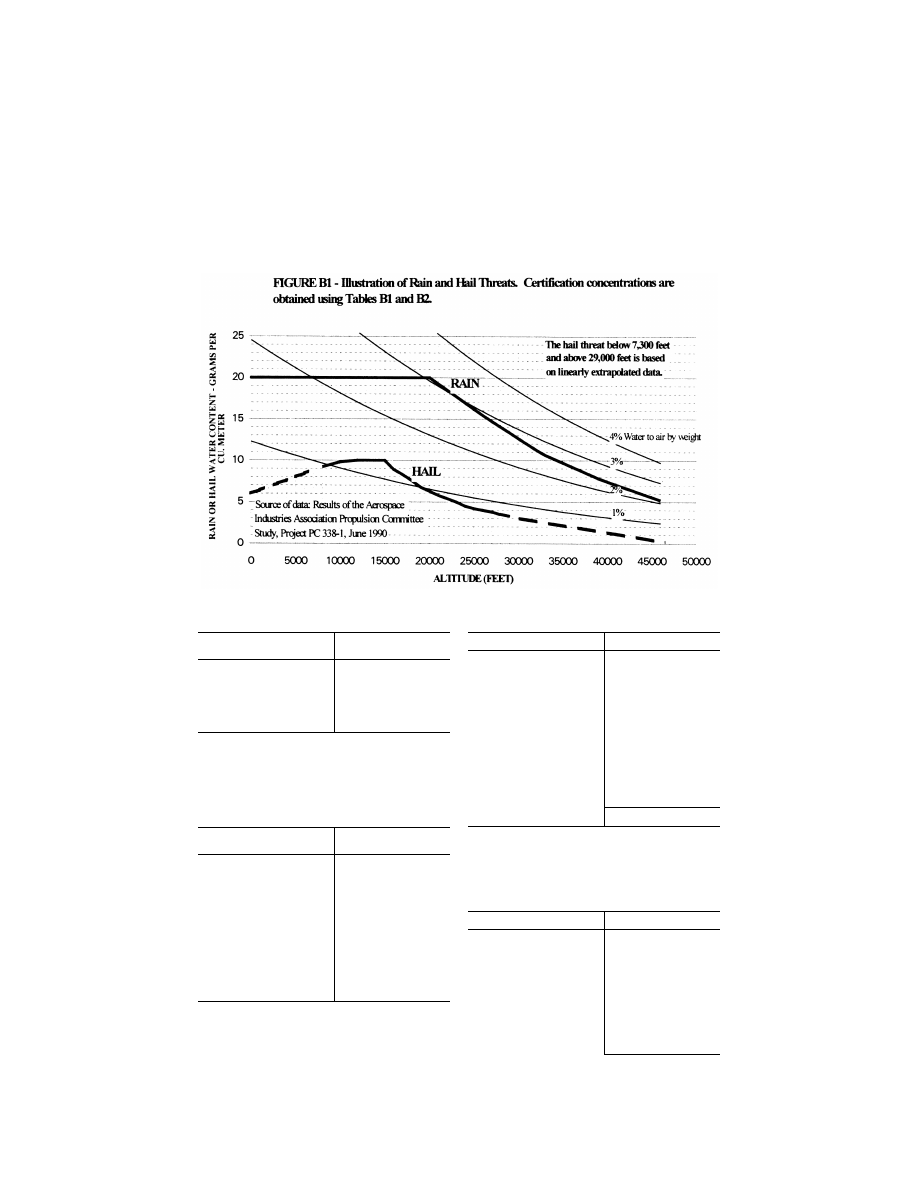
ABLE
B1—C
ERTIFICATION
S
TANDARD
A
TMOSPHERIC
R
AIN
C
ONCENTRATIONS
Altitude (feet)
Rain water content (RWC)
(grams water/meter
3
air)
0 .................................................
20.0
20,000 ........................................
20.0
26,300 ........................................
15.2
32,700 ........................................
10.8
39,300 ........................................
7.7
46,000 ........................................
5.2
RWC values at other altitudes may be determined by linear
interpolation.
N
OTE
: Source of data—Results of the Aerospace Industries
Association (AIA) Propulsion Committee Study, Project PC
338–1, June 1990.
T
ABLE
B2—C
ERTIFICATION
S
TANDARD
A
TMOSPHERIC
H
AIL
C
ONCENTRATIONS
Altitude (feet)
Hail water content (HWC)
(grams water/meter
3
air)
0 .................................................
6.0
7,300 ..........................................
8.9
8,500 ..........................................
9.4
10,000 ........................................
9.9
12,000 ........................................
10.0
15,000 ........................................
10.0
16,000 ........................................
8.9
17,700 ........................................
7.8
19,300 ........................................
6.6
21,500 ........................................
5.6
24,300 ........................................
4.4
29,000 ........................................
3.3
46,000 ........................................
0.2
HWC values at other altitudes may be determined by linear
interpolation. The hail threat below 7,300 feet and above
29,000 feet is based on linearly extrapolated data.
N
OTE
: Source of data—Results of the Aerospace Industries
Association (AIA Propulsion Committee (PC) Study, Project
PC 338–1, June 1990.
T
ABLE
B3—C
ERTIFICATION
S
TANDARD
A
TMOS
-
PHERIC
R
AIN
D
ROPLET
S
IZE
D
ISTRIBUTION
Rain droplet diameter (mm)
Contribution total RWC (%)
0–0.49 ........................................
0
0.50–0.99 ...................................
2.25
1.00–1.49 ...................................
8.75
1.50–1.99 ...................................
16.25
2.00–2.49 ...................................
19.00
2.50–2.99 ...................................
17.75
3.00–3.49 ...................................
13.50
3.50–3.99 ...................................
9.50
4.00–4.49 ...................................
6.00
4.50–4.99 ...................................
3.00
5.00–5.49 ...................................
2.00
5.50–5.99 ...................................
1.25
6.00–6.49 ...................................
0.50
6.50–7.00 ...................................
0.25
Total ............................
100.00
Median diameter of rain droplets in 2.66 mm
N
OTE
: Source of data—Results of the Aerospace Industries
Association (AIA Propulsion Committee (PC) Study, Project
PC 338–1, June 1990.
T
ABLE
B4—C
ERTIFICATION
S
TANDARD
A
TMOSPHERIC
H
AIL
S
IZE
D
ISTRIBUTION
Hail diameter (mm)
Contribution total HWC (%)
0–4.9 ..........................................
0
5.0–9.9 .......................................
17.00
10.0–14.9 ...................................
25.00
15.0–19.9 ...................................
22.50
20.0–24.9 ...................................
16.00
25.0–29.9 ...................................
9.75
30.0–34.9 ...................................
4.75
35.0–39.9 ...................................
2.50
40.0–44.9 ...................................
1.50
45.0–49.9 ...................................
0.75
50.0–55.0 ...................................
0.25
VerDate Mar<15>2010
10:12 Mar 18, 2014
Jkt 232046
PO 00000
Frm 00896
Fmt 8010
Sfmt 8002
Y:\SGML\232046.XXX
232046
ER26MR98.000</GPH>
pmangrum on DSK3VPTVN1PROD with CFR