AIM
4/3/14
9−1−5
Types of Charts Available
3. U.S. Terminal Procedures Publication
(TPP).
TPPs are published in 24 loose−leaf or
perfect bound volumes covering the conterminous
U.S., Puerto Rico and the Virgin Islands. A Change
Notice is published at the midpoint between revisions
in bound volume format and is available on the
internet for free download at the AeroNav web site.
(See FIG 9−1−9.) The TPPs include:
(a) Instrument Approach Procedure (IAP)
Charts.
IAP charts portray the aeronautical data that
is required to execute instrument approaches to
airports. Each chart depicts the IAP, all related
navigation data, communications information, and an
airport sketch. Each procedure is designated for use
with a specific electronic navigational aid, such as
ILS, VOR, NDB, RNAV, etc.
(b) Instrument Departure Procedure (DP)
Charts.
DP charts are designed to expedite
clearance delivery and to facilitate transition between
takeoff and en route operations. They furnish pilots’
departure routing clearance information in graphic
and textual form.
(c) Standard Terminal Arrival (STAR)
Charts.
STAR charts are designed to expedite ATC
arrival procedures and to facilitate transition between
en route and instrument approach operations. They
depict preplanned IFR ATC arrival procedures in
graphic and textual form. Each STAR procedure is
presented as a separate chart and may serve either a
single airport or more than one airport in a given
geographic area.
(d) Airport Diagrams.
Full page airport
diagrams are designed to assist in the movement of
ground traffic at locations with complex runway/taxi-
way configurations and provide information for
updating geodetic position navigational systems
aboard aircraft. Airport diagrams are available for
free download at the AeroNav website.
4. Alaska Terminal Procedures Publication.
This publication contains all terminal flight proce-
dures for civil and military aviation in Alaska.
Included are IAP charts, DP charts, STAR charts,
airport diagrams, radar minimums, and supplementa-
ry support data such as IFR alternate minimums,
take−off minimums, rate of descent tables, rate of
climb tables and inoperative components tables.
Volume is 5−3/8 x 8−1/4 inch top bound. Publication
revised every 56 days with provisions for a Terminal
Change Notice, as required.
c. Planning Charts.
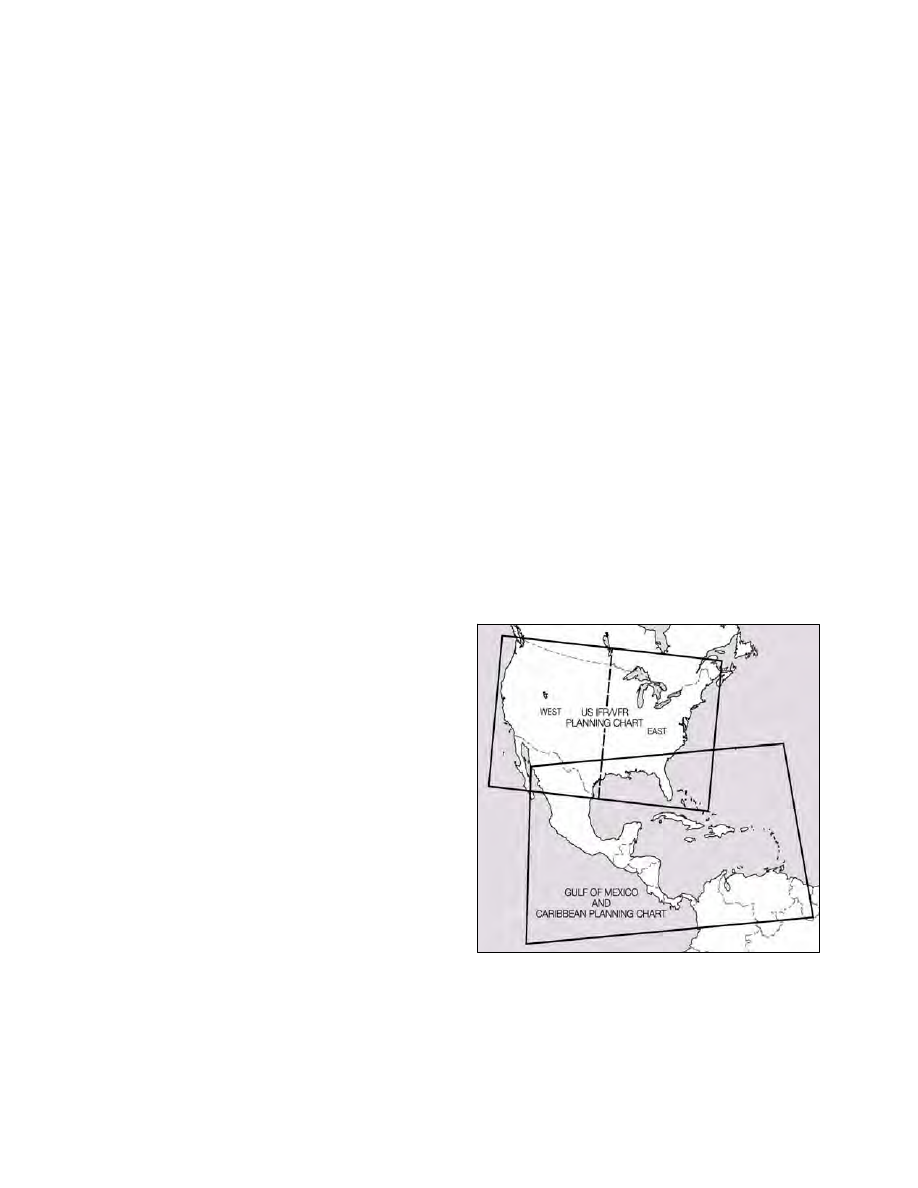
1. U.S. IFR/VFR Low Altitude Planning
Chart.
This chart is designed for prefight and
en route flight planning for IFR/VFR flights.
Depiction includes low altitude airways and mileage,
NAVAIDs, airports, special use airspace, cities, times
zones, major drainage, a directory of airports with
their airspace classification, and a mileage table
showing great circle distances between major
airports. Scale 1 inch = 47nm/1:3,400,000. Chart
revised annually, and is available either folded or
unfolded for wall mounting. (See FIG 9−1−6.)
2. Gulf of Mexico and Caribbean Planning
Chart.
This is a VFR planning chart on the reverse
side of the Puerto Rico − Virgin Islands VFR Terminal
Area Chart.
Information shown includes mileage
between airports of entry, a selection of special use
airspace and a directory of airports with their
available services. Scale 1 inch = 85nm/1:6,192,178.
60 x 20 inches folded to 5 x 10 inches. Chart revised
annually. (See FIG 9−1−6.)
FIG 9
−1−6
Planning Charts
3. Charted VFR Flyway Planning Charts.
This chart is printed on the reverse side of selected
TAC charts. The coverage is the same as the
associated TAC. Flyway planning charts depict flight
paths and altitudes recommended for use to bypass
high traffic areas. Ground references are provided as