AIM
4/3/14
9−1−6
Types of Charts Available
a guide for visual orientation. Flyway planning charts
are designed for use in conjunction with TACs and
sectional charts and are not to be used for navigation.
Chart scale 1 inch = 3.43nm/1:250,000.
d. Supplementary Charts and Publications.
1. Airport/Facility Directory (A/FD).
This
7−volume booklet series contains data on airports,
seaplane bases, heliports, NAVAIDs, communica-
tions data, weather data sources, airspace, special
notices, and operational procedures. Coverage
includes the conterminous U.S., Puerto Rico, and the
Virgin Islands. The A/FD shows data that cannot be
readily depicted in graphic form; e.g., airport hours of
operations, types of fuel available, runway widths,
lighting codes, etc. The A/FD also provides a means
for pilots to update visual charts between edition
dates (A/FD is published every 56 days while
sectional and Terminal Area Charts are generally
revised every six months). The VFR Chart Update
Bulletins are available for free download from the
AeroNav web site. Volumes are side−bound 5−3/8 x
8−1/4 inches. (See FIG 9−1−10.)
2. Supplement Alaska.
This is a civil/military
flight information publication issued by FAA every
56 days. It is a single volume booklet designed for use
with appropriate IFR or VFR charts. The Supplement
Alaska contains an A/FD, airport sketches, commu-
nications data, weather data sources, airspace, listing
of navigational facilities, and special notices and
procedures. Volume is side−bound 5−3/8 x
8−1/4 inches.
3. Chart Supplement Pacific.
This supple-
ment is designed for use with appropriate VFR or IFR
enroute charts. Included in this one−volume booklet
are the A/FD, communications data, weather data
sources, airspace, navigational facilities, special
notices, and Pacific area procedures. IAP charts, DP
charts, STAR charts, airport diagrams, radar
minimums, and supporting data for the Hawaiian and
Pacific Islands are included. The manual is published
every 56 days. Volume is side−bound 5−3/8 x
8−1/4 inches.
4. North Pacific Route Charts.
These charts
are designed for FAA controllers to monitor
transoceanic flights. They show established intercon-
tinental air routes, including reporting points with
geographic positions. Composite Chart: Scale
1 inch = 164nm/1:12,000,000. 48 x 41−1/2 inches.
Area Charts: Scale 1 inch = 95.9nm/1:7,000,000.
52 x 40−1/2 inches. All charts shipped unfolded.
Charts revised every 56 days. (See FIG 9−1−8.)
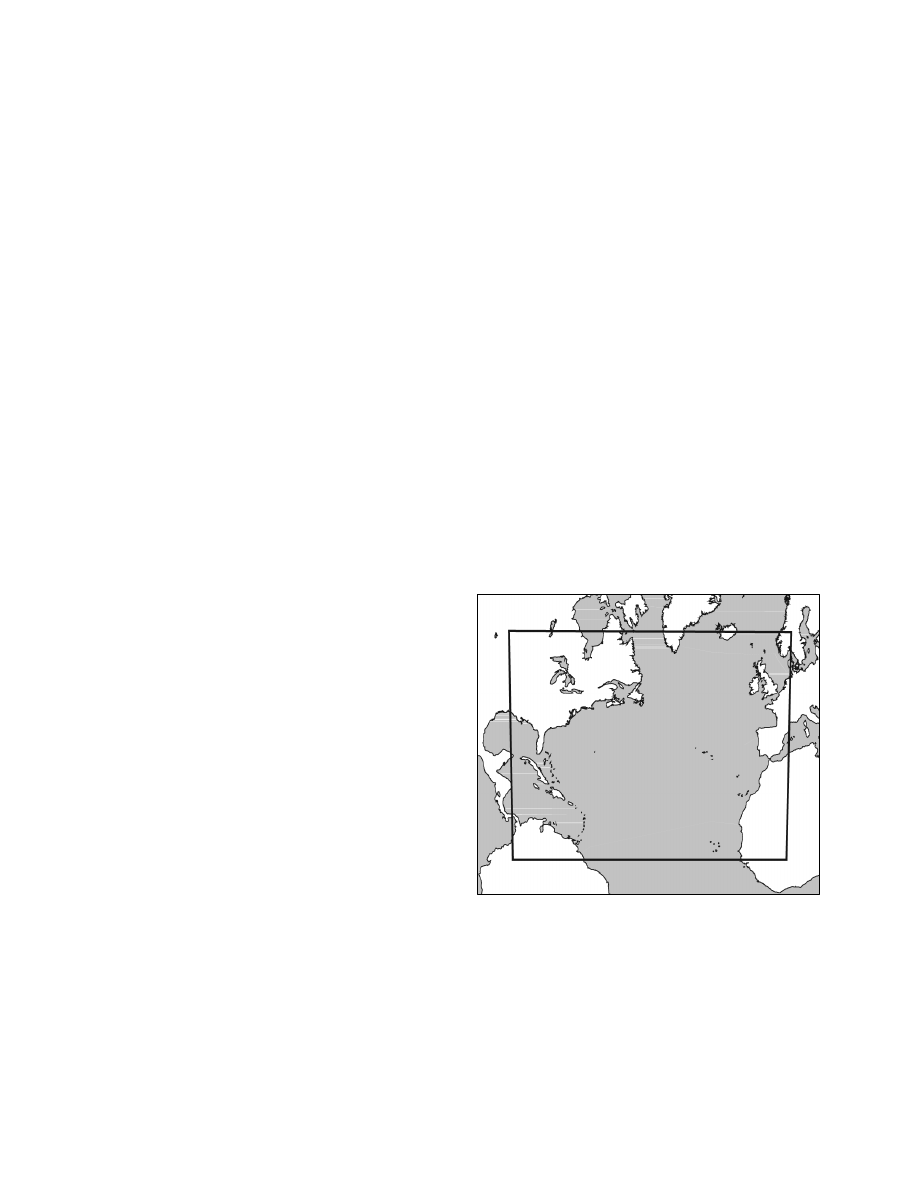
5. North Atlantic Route Chart.
Designed for
FAA controllers to monitor transatlantic flights, this
5−color chart shows oceanic control areas, coastal
navigation aids, oceanic reporting points, and
NAVAID geographic coordinates. Full Size Chart:
Scale 1 inch = 113.1nm/1:8,250,000. Chart is shipped
flat only. Half Size Chart: Scale 1 inch =
150.8nm/1:11,000,000. Chart is 29−3/4 x
20−1/2 inches, shipped folded to 5 x 10 inches only.
Chart revised every 56 weeks. (See FIG 9−1−7.)
FIG 9
−1−7
North Atlantic Route Charts